Introduction
In today’s cloud-first world, understanding your organization’s security posture is crucial. Commercial Cloud Security Posture Management (CSPM) tools can cost thousands of dollars per month, putting them out of reach for many smaller teams, labs, and organizations with limited security budgets. But what if I told you that you could build much of this capability yourself using free, open-source tools and a bit of SQL knowledge?
In this blog post, I’ll show you how to leverage DuckDB and Tailpipe to analyze AWS CloudTrail logs, effectively creating a DIY CSPM solution that provides valuable security insights without the enterprise price tag.
The Challenge: Cloud Security on a Budget
Most security teams face a common dilemma: the need to monitor, detect, and respond to security issues across cloud environments without breaking the bank. Commercial CSPM tools offer rich features but often at a cost that smaller organizations can’t justify, especially for lab environments, educational institutions, or startups.
This leads many security professionals to one of two suboptimal choices:
- Spend money they don’t have on commercial tools
- Operate with limited visibility into their cloud security posture
But there’s a third option: building focused, effective security monitoring using open-source tools and SQL.
What is CSPM and Why Does It Matter?
Cloud Security Posture Management is a category of tools and processes that help organizations ensure their cloud environments are configured securely and comply with security best practices and regulatory requirements.
Traditional CSPM solutions generally handle:
- Configuration assessment against security standards
- Continuous compliance monitoring
- Risk identification and prioritization
- Remediation guidance
- Drift detection (changes from secure baselines)
CSPM is important because cloud environments are:
- Dynamic and constantly changing
- Composed of many interconnected services
- Often controlled through infrastructure-as-code
- Subject to compliance requirements
- Vulnerable to misconfigurations
For AWS environments, CloudTrail logs provide a goldmine of information about what’s happening in your account. These logs record API calls made by users, roles, and AWS services, capturing who did what, when, and from where. With the right tools and queries, you can turn this data into actionable security insights.
Enter DuckDB and Tailpipe
What is DuckDB?
DuckDB is an in-process SQL OLAP (Online Analytical Processing) database designed for analytical queries on large datasets. It’s often described as “SQLite for analytics” and provides impressive performance for data analysis tasks. Some key features that make it perfect for our DIY CSPM approach:
- Runs entirely in-process (no separate server)
- Fast analytical processing
- Low memory footprint
- Works with data in various formats (JSON, CSV, Parquet)
- Familiar SQL syntax
- Easy installation and configuration
What is Tailpipe?
Tailpipe is an open-source SIEM (Security Information and Event Management) tool built on top of DuckDB. Developed by Turbot, it allows you to:
- Collect logs from various sources (including AWS CloudTrail)
- Query them using standard SQL
- Process millions of records on your local machine
- Work completely offline with your logs
- Avoid sending sensitive data to third-party services
Tailpipe runs entirely on your local machine, using DuckDB’s analytical capabilities to process large volumes of log data efficiently.
Setting Up Your DIY CSPM Environment
Prerequisites
Before getting started, make sure you have:
- AWS account with CloudTrail enabled and logs stored in S3
- Basic SQL knowledge
- Terminal access on your machine
- AWS credentials configured (via AWS CLI profiles or environment variables)
Installation
- Install Tailpipe:
# Using Homebrew on macOS
brew install turbot/tap/tailpipe

# Or using the install script on Linux/macOS
sudo /bin/sh -c "$(curl -fsSL https://tailpipe.io/install/tailpipe.sh)"

# For Windows users
# Visit https://tailpipe.io for download options- Create a configuration file to connect to your CloudTrail logs:
Create a file named ~/.tailpipe/config/aws.tpc with the following content:
connection "aws" "prod" {
  profile = "your-aws-profile-name"  # Your AWS profile name
}

partition "aws_cloudtrail_log" "my_s3_bucket" {
  source "aws_s3_bucket" {
    connection = connection.aws.prod
    bucket = "your-cloudtrail-bucket-name"  # Your CloudTrail bucket
    file_layout = "aws_org_id/AWSLogs/aws_org_id/%{NUMBER:account_id}/CloudTrail/us-east-1/%{NUMBER:year}/%{NUMBER:month}/%{NUMBER:day}/%{DATA}.json.gz"
  }
}
This looks a lot like Hashicorp’s configuration language https://github.com/hashicorp/hcl because it is! Tailpipe has a robust plugin setup with support for cloud service providers ranging from AWS, Azure, GCP, Kubernetes, and even God’s own forbidden cloud provider OCI!
Let’s install the AWS plugin for Tailpipe:
tailpipe plugin install awsBefore Tailpipe can collect our CloudTrail logs, we need to authenticate to AWS. Depending on your credential chain you might need to set your AWS_PROFILE environment variable or run aws configure with the keys that have access to your chosen S3 bucket. I choose to set my profile:
export AWS_PROFILE=log-archiveBefore we can query our data we have to tell Tailpipe to collect it.
tailpipe collect aws_cloudtrail_log.my_s3_bucketThis will download the all the files that match the pattern we provided in the config file. The example config will conform to an AWS Organizations CloudTrail logging bucket file pattern, looking for files that match the CloudTrail log json.gz’s and import them.
Your output may look similar to mine:

- Test your configuration:
Let’s use SQL to query the number of records in our table:
tailpipe query "select count(*) from aws_cloudtrail_log"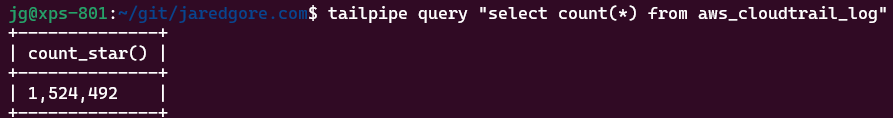
If everything is set up correctly, you should see a count of your CloudTrail log entries.
Understanding CloudTrail Log Structure
Before diving into security queries, it’s important to understand the structure of CloudTrail logs. Each log entry contains detailed information about the API call, including:
event_time: When the API call occurredevent_name: The specific API action (e.g.,CreateUser,DeleteBucket)event_source: The AWS service (e.g.,iam.amazonaws.com,s3.amazonaws.com)user_identity: Information about who made the call (type, ARN, account ID)source_ip_address: The IP address from which the request originateduser_agent: Information about the caller’s clientrequest_parameters: The parameters sent with the requestresponse_elements: The response from the API callerror_codeanderror_message: For failed API calls
The user_identity field is particularly rich, containing information about the entity that performed the action. It’s a nested structure with fields like:
type(e.g.,IAMUser,AssumedRole,Root)principal_idarnaccount_idsession_context(for assumed roles)
Understanding these fields is crucial for writing effective security queries.
Essential Security Queries for CloudTrail Analysis
Let’s explore some security-focused SQL queries that can help you understand your AWS security posture. These queries are designed to highlight potential security risks, suspicious activities, and compliance issues.
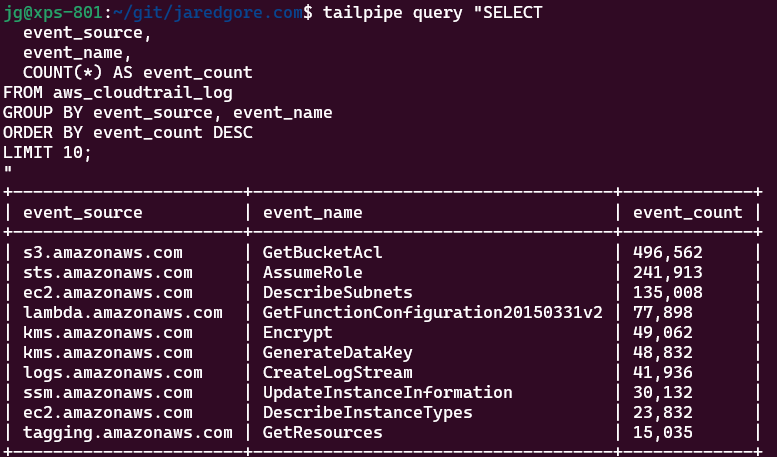
1. Most Active Services and APIs
Start with a high-level view of your AWS usage patterns. This query identifies which AWS services and APIs are most frequently used:
SELECT
  event_source,
  event_name,
  COUNT(*) AS event_count
FROM aws_cloudtrail_log
GROUP BY event_source, event_name
ORDER BY event_count DESC
LIMIT 10;
This baseline helps you understand normal activity patterns, making it easier to spot anomalies later.
2. Unauthorized Access Attempts
Failed API calls can indicate attempted unauthorized access or misconfigured permissions:
SELECT
  event_time,
  event_source,
  event_name,
  error_code,
  error_message,
  user_identity.type AS identity_type,
  user_identity.principal_id,
  source_ip_address
FROM aws_cloudtrail_log
WHERE error_code IS NOT NULL
ORDER BY event_time DESC
LIMIT 100;
Look for patterns in the error_code values. Common ones to watch include AccessDenied, UnauthorizedOperation, or AuthorizationError.
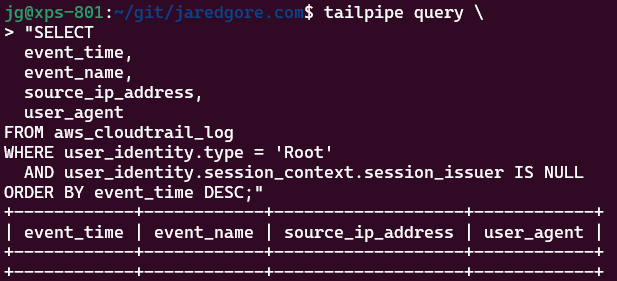
3. Root Account Usage (High-Risk Activity)
Root account usage should be minimal and carefully monitored. Any use of the root account could indicate a security concern:
SELECT
  event_time,
  event_name,
  source_ip_address,
  user_agent
FROM aws_cloudtrail_log
WHERE user_identity.type = 'Root'
  AND user_identity.session_context.session_issuer IS NULL
ORDER BY event_time DESC;
Ideally, this query should return few or no results, as the root account should rarely be used in a properly secured AWS environment.
4. Security Group Modifications
Security groups control network access to your resources. Changes to security groups could potentially expose services to unauthorized access:
SELECT
  event_time,
  event_name,
  user_identity.arn AS user_arn,
  request_parameters,
  response_elements
FROM aws_cloudtrail_log
WHERE event_source = 'ec2.amazonaws.com'
  AND event_name LIKE '%SecurityGroup%'
ORDER BY event_time DESC;
Pay special attention to any changes that might add overly permissive inbound rules (e.g., opening ports to 0.0.0.0/0).
5. S3 Bucket Policy Changes
S3 buckets are frequently involved in data breaches when their access policies are misconfigured. This query tracks changes to bucket policies and public access settings:
SELECT
  event_time,
  event_name,
  user_identity.arn AS user_arn,
  request_parameters
FROM aws_cloudtrail_log
WHERE event_source = 's3.amazonaws.com'
  AND (event_name LIKE '%BucketPolicy%'
       OR event_name LIKE '%PublicAccess%')
ORDER BY event_time DESC;
Review the request_parameters field to understand what changes were made.
6. IAM Policy and Role Changes
Changes to IAM policies and roles can have significant security implications by modifying who has what permissions:
SELECT
  event_time,
  event_name,
  user_identity.arn AS user_arn,
  request_parameters
FROM aws_cloudtrail_log
WHERE event_source = 'iam.amazonaws.com'
  AND (event_name LIKE '%Policy%'
       OR event_name LIKE '%Role%')
  AND event_name NOT LIKE '%Get%'
  AND event_name NOT LIKE '%List%'
ORDER BY event_time DESC;
Look for unexpected policy changes, especially those granting admin-level privileges or excessive permissions.
7. Suspicious Console Logins
Monitoring console login activity can help identify unauthorized access attempts:
SELECT
  event_time,
  source_ip_address,
  user_agent,
  user_identity.principal_id,
  additional_event_data
FROM aws_cloudtrail_log
WHERE event_name = 'ConsoleLogin'
ORDER BY event_time DESC;
Pay attention to logins from unusual IP addresses, unusual times, or unusual user agents.
8. Console Logins Without MFA
Login attempts without multi-factor authentication represent a security risk:
SELECT
  event_time,
  user_identity.arn AS user_arn,
  source_ip_address,
  user_agent,
  additional_event_data
FROM aws_cloudtrail_log
WHERE
  event_name = 'ConsoleLogin'
  AND (
    additional_event_data::text LIKE '%"MFAUsed":"No"%'
    OR additional_event_data::text NOT LIKE '%"MFAUsed"%'
  )
  AND error_code IS NULL
ORDER BY event_time DESC;
This helps identify users who should be configured to use MFA for additional security.
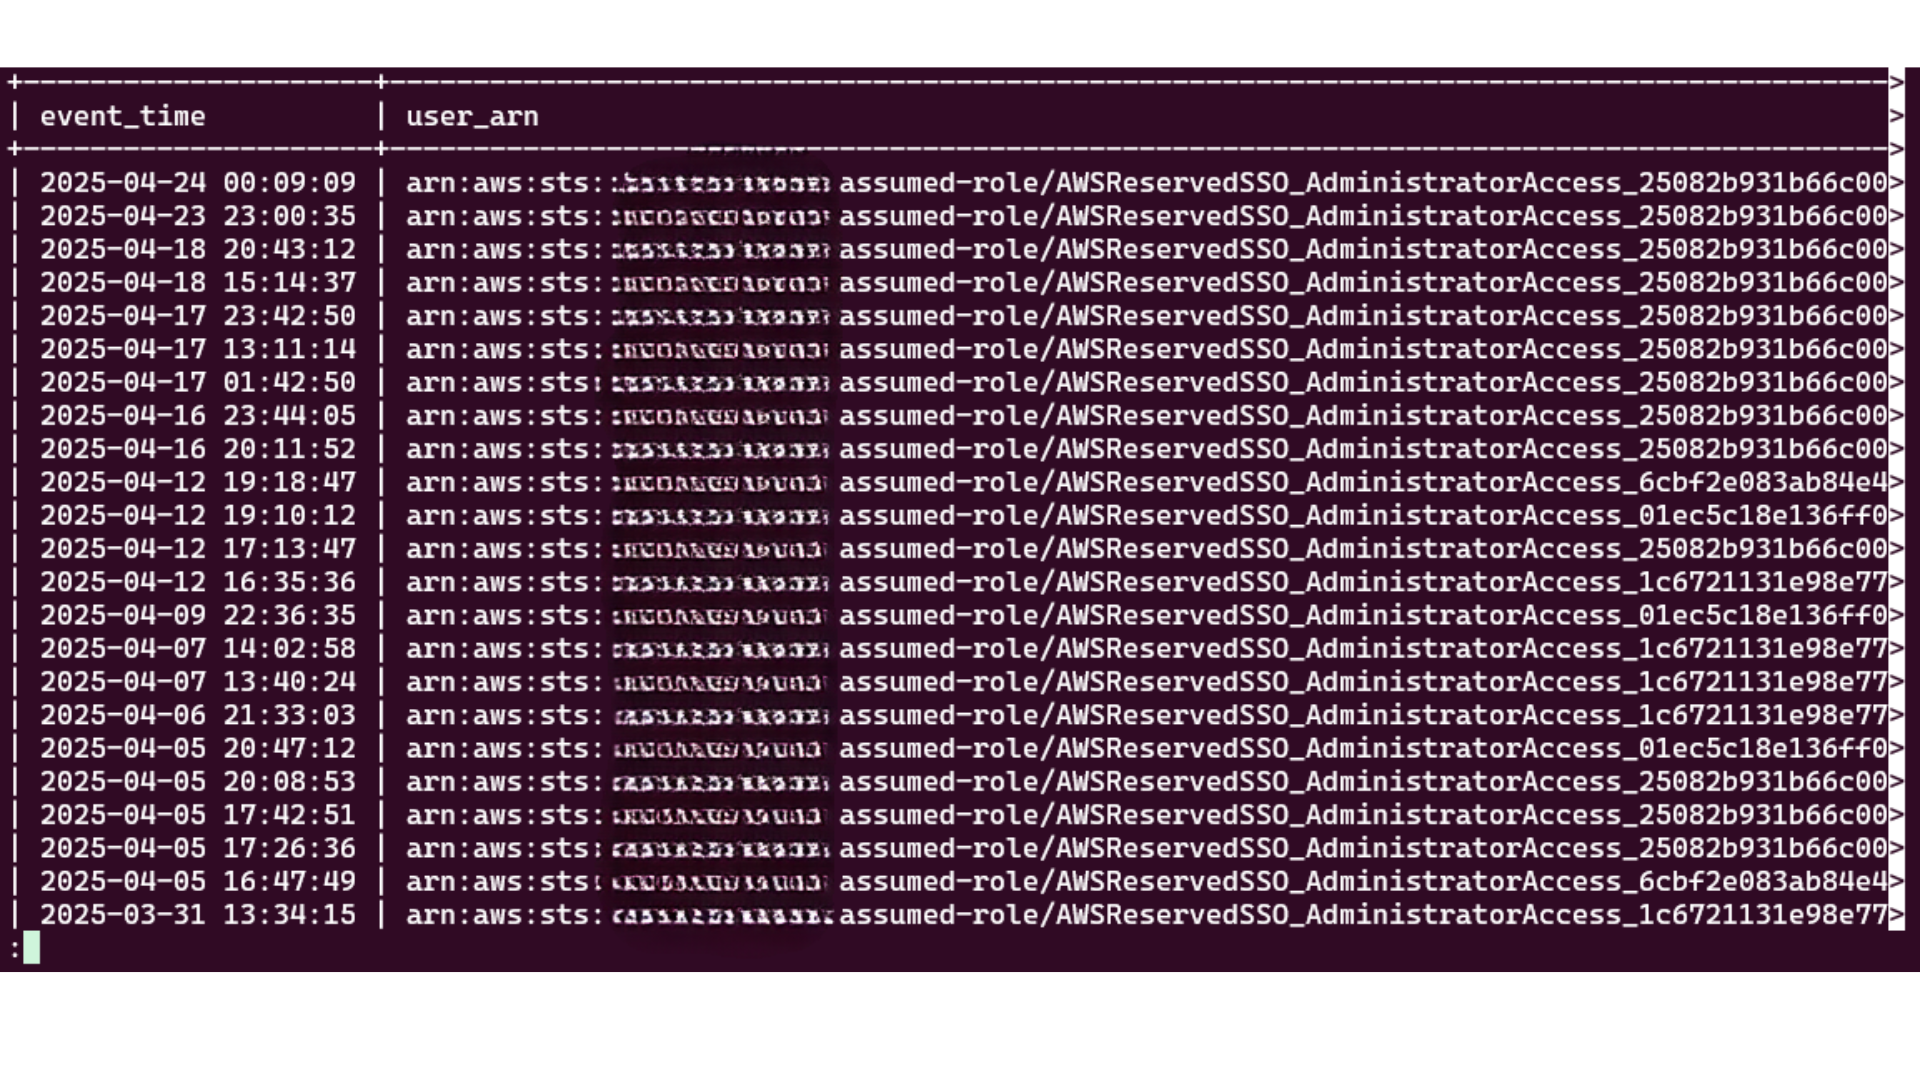
My query results show AssumeRole actions rather than traditional ConsoleLogin events with MFA flags because my cloud lab environment uses federated authentication through Microsoft Entra ID/Azure AD. When a user in my AWS Org authenticates, they first log in to my IdP, which handles the MFA verification process. After successful authentication, the IdP uses AWS’s Security Token Service (STS) to assume a role on behalf of the user, creating temporary security credentials. This creates a different pattern in CloudTrail logs, where you’ll see AssumeRole actions with varying JSON structures in the additional_event_data and response_elements fields rather than direct AWS console logWhy My Query Shows AssumeRole Instead of MFA Logins.
So here’s what’s happening with these query results: instead of seeing regular ConsoleLogin events with MFA flags, I’m getting all these AssumeRole actions because we’re using Microsoft Entra ID for login. Basically, when someone logs into AWS in my organization, they don’t go straight to AWS - they hit our Microsoft tenant first, which takes care of all the MFA stuff.
Once they’ve proven who they are (with their password, phone app, whatever), Microsoft turns around and talks to AWS behind the scenes, using AssumeRole to get temporary credentials. That’s why the CloudTrail logs look different - you’re seeing this handoff between systems rather than a direct AWS login.
This is why the JSON in my logs looks so weird in those additional_event_data and response_elements fields. If you’re trying to monitor login security in a setup like mine, you need to look at these AssumeRole events instead of traditional logins.ins with explicit MFA flags. To properly monitor login security in federated setups, focus on the AssumeRole events and their associated authentication context.
9. Resource Deletions
Tracking resource deletions can help identify potential data loss or service disruptions:
SELECT
  event_time,
  event_source,
  event_name,
  user_identity.arn AS user_arn,
  request_parameters
FROM aws_cloudtrail_log
WHERE event_name LIKE '%Delete%'
  AND event_name NOT LIKE '%Get%'
  AND event_name NOT LIKE '%List%'
ORDER BY event_time DESC;
Review unexpected deletions that could impact availability or indicate malicious activity.
10. Detect Public Resource Creation
Identifying resources exposed to the public internet is critical for preventing data breaches:
SELECT
  event_time,
  event_name,
  user_identity.arn AS user_arn,
  request_parameters,
  response_elements
FROM aws_cloudtrail_log
WHERE
  -- Look for public S3 bucket creation/modification
  (event_source = 's3.amazonaws.com' AND
   (request_parameters LIKE '%AllUsers%' OR
    request_parameters LIKE '%AuthenticatedUsers%')) OR
  -- Look for public EBS snapshots
  (event_source = 'ec2.amazonaws.com' AND
   event_name = 'ModifySnapshotAttribute' AND
   request_parameters LIKE '%all%') OR
  -- Look for public ECR repositories
  (event_source = 'ecr.amazonaws.com' AND
   event_name = 'SetRepositoryPolicy' AND
   request_parameters LIKE '%"Effect":"Allow","Principal":"*"%')
ORDER BY event_time DESC;
Advanced Security Analysis
Beyond basic security queries, you can use Tailpipe and DuckDB for more sophisticated security analyses.
Time-Based Analysis for Off-Hours Activity
Identify activity that occurs outside normal business hours, which might indicate suspicious behavior:
SELECT
  event_time,
  event_name,
  user_identity.arn AS user_arn,
  source_ip_address
FROM aws_cloudtrail_log
WHERE
  (EXTRACT(HOUR FROM event_time) < 6 OR
   EXTRACT(HOUR FROM event_time) > 20 OR
   EXTRACT(DOW FROM event_time) IN (0, 6)) -- Weekend days (0=Sunday, 6=Saturday)
  AND user_identity.type != 'AWSService' -- Exclude AWS service activity
ORDER BY event_time DESC
LIMIT 100;
Activity by Source IP Address (Unusual Access)
Analyzing activity by source IP can help identify unusual access patterns:
SELECT
  source_ip_address,
  COUNT(*) AS event_count,
  COUNT(DISTINCT user_identity.arn) AS unique_identities,
  array_agg(DISTINCT event_source) AS services_accessed,
  MIN(event_time) AS first_seen,
  MAX(event_time) AS last_seen
FROM aws_cloudtrail_log
WHERE source_ip_address IS NOT NULL
GROUP BY source_ip_address
ORDER BY event_count DESC;
Look for IP addresses that appear infrequently or that access a wide range of services.
Temporary Credential Usage (AssumeRole)
Tracking temporary credential usage through role assumptions:
SELECT
  event_time,
  user_identity.arn AS assuming_principal,
  request_parameters->>'roleArn' AS assumed_role_arn,
  source_ip_address,
  user_agent
FROM aws_cloudtrail_log
WHERE event_name = 'AssumeRole'
ORDER BY event_time DESC;
This helps identify who is using temporary credentials and for what purposes.
CloudTrail Changes (Logging Tampering)
Any changes to CloudTrail itself could indicate an attempt to hide malicious activity:
SELECT
  event_time,
  event_name,
  user_identity.arn AS user_arn,
  request_parameters,
  response_elements
FROM aws_cloudtrail_log
WHERE
  event_source = 'cloudtrail.amazonaws.com' OR
  (event_source = 's3.amazonaws.com' AND
   (request_parameters LIKE '%cloudtrail%' OR
    resource_name LIKE '%cloudtrail%'))
ORDER BY event_time DESC;
Building Continuous Monitoring with Automation
To make your DIY CSPM solution truly effective, you need to automate the execution of these queries and the reporting of results. Here are some approaches:
1. Scheduled Query Execution with Cron
Create a shell script that runs your most important security queries:
#!/bin/bash

# Define output directory
OUTPUT_DIR="./security_reports/$(date +%Y-%m-%d)"
mkdir -p $OUTPUT_DIR

# Run security queries
echo "Running security queries..."

tailpipe collect aws_cloudtrail_logs

# Root account usage
tailpipe query "SELECT event_time, event_name, source_ip_address FROM aws_cloudtrail_log WHERE user_identity.type = 'Root' AND event_time > current_date - interval '1 day'" -o csv > "$OUTPUT_DIR/root_account_usage.csv"

# Failed logins
tailpipe query "SELECT event_time, source_ip_address, error_message FROM aws_cloudtrail_log WHERE event_name = 'ConsoleLogin' AND error_code IS NOT NULL AND event_time > current_date - interval '1 day'" -o csv > "$OUTPUT_DIR/failed_logins.csv"

# Security group changes
tailpipe query "SELECT event_time, user_identity.arn, event_name, request_parameters FROM aws_cloudtrail_log WHERE event_source = 'ec2.amazonaws.com' AND event_name LIKE '%SecurityGroup%' AND event_time > current_date - interval '1 day'" -o csv > "$OUTPUT_DIR/security_group_changes.csv"

echo "Security reports generated in $OUTPUT_DIR"
Schedule this script to run daily using cron:
0 8 * * * /path/to/security_queries.sh2. Integrating with Alerting Systems
For critical security issues, you might want real-time alerts. You can pipe the output of your queries to a notification system:
# Check for root account usage and send alert if found
COUNT=$(tailpipe query "SELECT COUNT(*) FROM aws_cloudtrail_log WHERE user_identity.type = 'Root' AND event_time > current_timestamp - interval '1 hour'" -o csv | tail -n 1)

if [ "$COUNT" -gt "0" ]; then
  # Send alert via AWS SNS
  aws sns publish \
    --topic-arn "arn:aws:sns:us-east-1:123456789012:security-alerts" \
    --subject "AWS Security Alert" \
    --message "ALERT: Root account usage detected in the last hour!"
fi
3. Integration with Visualization Tools
For more advanced visualization, you can export your query results and load them into visualization tools:
# Export data for dashboard
tailpipe query "SELECT event_source, COUNT(*) AS count FROM aws_cloudtrail_log WHERE event_time > current_date - interval '7 day' GROUP BY event_source ORDER BY count DESC" -o json > dashboard_data.json
Check out a dashboard of some real results here!
Extending Your DIY CSPM with Powerpipe
While Tailpipe gives you powerful query capabilities, Powerpipe (another tool from Turbot) provides visualization and dashboarding capabilities. Together, they form a more comprehensive CSPM solution.
To set up Powerpipe with CloudTrail detection dashboards:
- Install Powerpipe:
brew install turbot/tap/powerpipe- Install the CloudTrail detections mod:
mkdir dashboards
cd dashboards
powerpipe mod install github.com/turbot/tailpipe-mod-aws-cloudtrail-log-detections- Run the dashboard:
powerpipe server- View the dashboards at http://localhost:9033
The mod provides multiple benchmarks with pre-built detections aligned with frameworks like MITRE ATT&CK, making it easier to identify and respond to security threats.
Comparing to Commercial CSPM Solutions
While our DIY approach provides significant value, it’s important to understand how it compares to commercial CSPM solutions:
| Feature | DIY CSPM | Commercial CSPM |
|---|---|---|
| Cost | Very low (mostly free) | Often thousands per month |
| Setup complexity | Moderate | Usually simple |
| Data privacy | High (all local) | Varies by vendor |
| Customization | Very high | Usually limited |
| Pre-built rules | Limited (community) | Extensive |
| Multi-cloud | Limited | Usually comprehensive |
| Auto-remediation | Manual implementation | Often built-in |
| Compliance reporting | Basic (manual) | Comprehensive |
The DIY approach excels in cost, privacy, and customization, while commercial solutions typically offer broader coverage and more built-in features.
Performance Considerations
When working with large CloudTrail datasets, performance can become an issue. Here are some tips to improve performance:
1. Use Time-Based Filtering
Always include time-based filters in your queries to reduce the data processed:
-- Instead of:
SELECT * FROM aws_cloudtrail_log WHERE event_name = 'ConsoleLogin';

-- Use:
SELECT * FROM aws_cloudtrail_log WHERE event_name = 'ConsoleLogin' AND event_time > current_date - interval '30 day';
2. Create Materialized Views for Common Queries
What are Database Views?
Database views provide a powerful way to simplify complex queries and secure access to your CloudTrail data. Unlike tables that store data physically, views are virtual tables defined by SQL queries that execute each time they’re accessed, always reflecting current data. When analyzing CloudTrail logs, views let you create logical abstractions like suspicious_activity or compliance_violations that hide complex filtering logic while ensuring analysts always see fresh results. They’re particularly valuable for creating standardized security checks that multiple team members can reference without duplicating complex query logic. While views don’t offer the performance benefits of materialized views, they provide flexibility and always-current data access without consuming additional storage space.
If you repeatedly run certain analyses, consider creating materialized views:
CREATE TABLE security_events AS
SELECT
  event_time,
  event_source,
  event_name,
  user_identity.arn AS user_arn,
  source_ip_address,
  error_code
FROM aws_cloudtrail_log
WHERE
  (event_source = 'iam.amazonaws.com' OR
   event_name LIKE '%Login%' OR
   event_name LIKE '%SecurityGroup%' OR
   event_name LIKE '%Bucket%' OR
   error_code IS NOT NULL) AND
  event_time > current_date - interval '90 day';
Then query this table instead of the full logs for faster results.
3. Output Optimized Formats
When storing query results, use efficient formats like Parquet:
tailpipe query "SELECT * FROM aws_cloudtrail_log WHERE event_time > current_date - interval '30 day'" -o parquet > recent_logs.parquetSecurity and Compliance Use Cases
Here are some specific use cases where this DIY CSPM approach proves valuable:
Compliance Monitoring
For regulated environments, you can create queries that check for compliance with specific standards:
-- PCI DSS 3.2.1 Requirement 10.2.2: All actions by users with admin privileges
SELECT
  event_time,
  event_name,
  user_identity.arn AS user_arn,
  source_ip_address
FROM aws_cloudtrail_log
WHERE
  user_identity.arn LIKE '%admin%' OR
  user_identity.arn LIKE '%Admin%' OR
  (event_source = 'iam.amazonaws.com' AND event_name LIKE '%Admin%')
ORDER BY event_time DESC;
Security Audit Preparation
Prepare for security audits by generating reports that demonstrate your security controls:
-- Report on all security-relevant changes in the last 90 days
SELECT
  date_trunc('day', event_time) AS day,
  event_source,
  event_name,
  COUNT(*) AS count
FROM aws_cloudtrail_log
WHERE
  (event_source IN ('iam.amazonaws.com', 'kms.amazonaws.com', 'cloudtrail.amazonaws.com') OR
   event_name LIKE '%Security%' OR
   event_name LIKE '%Encrypt%' OR
   event_name LIKE '%Policy%') AND
  event_time > current_date - interval '90 day'
GROUP BY day, event_source, event_name
ORDER BY day DESC, count DESC;
Incident Response
During a security incident, quickly gather relevant information:
-- Find all activity from a suspicious IP address
SELECT
  event_time,
  event_source,
  event_name,
  user_identity.arn AS user_arn,
  request_parameters
FROM aws_cloudtrail_log
WHERE source_ip_address = '192.0.2.123'
ORDER BY event_time;

-- Find all activity by a potentially compromised user
SELECT
  event_time,
  event_source,
  event_name,
  source_ip_address,
  user_agent,
  request_parameters
FROM aws_cloudtrail_log
WHERE user_identity.arn = 'arn:aws:iam::123456789012:user/compromised-user'
ORDER BY event_time;
Conclusion
Building your own CSPM solution using DuckDB, Tailpipe, and SQL provides a powerful, cost-effective way to monitor your AWS environment’s security posture. While it may not have all the bells and whistles of commercial solutions, it offers several significant advantages:
- Complete control over your security data
- Customizable queries tailored to your specific needs
- Negligible cost compared to commercial tools
- Valuable learning experience about cloud security
- No vendor lock-in
By starting with the queries in this blog post and gradually expanding your analysis, you can build a robust security monitoring system that meets your organization’s needs without breaking the bank.
Remember that security is an ongoing process, not a one-time project. Continuously refine your queries, automate your monitoring, and adapt to new threats and AWS services to maintain an effective security posture.
Resources
- Tailpipe GitHub
- Tailpipe Hub
- AWS CloudTrail Detections Mod
- DuckDB Documentation
- AWS CloudTrail Documentation
- MITRE ATT&CK Framework
What DIY security monitoring have you implemented? Share your experiences and queries in the comments!
Disclaimer: This article describes tools and techniques for security monitoring but is not a substitute for a comprehensive security program. Always follow security best practices and consult with security professionals for your specific environment.